C3 Charts Examples
The library offers a charts component that allows you to render your pre-configured c3 chart without the need to worry about DOM changes. It simply takes a configuration file and the element that the chart will be bound to as props, and does the rest.
You can find the code used in this example here.
We will be buildling upon the quickstart demo set up here.
First we execute the patternfly C3 code once in a global context using script-loader in our index entry:
index.jsx:
import { render } from "react-dom";
import React from "react";
import { Provider } from "react-redux";
import App from "./pf-lib/appContainer/App.jsx";
import store from "./store";
import {viewsConfig, navbarConfig} from './configs'

// Here we use script loader to execute this script once in a global context
import 'script-loader!../../node_modules/patternfly/node_modules/c3/c3.min';

// We can do the same with d3 if we wanted to
import 'script-loader!../../node_modules/patternfly/node_modules/d3/d3.min';

render (
  <Provider store={store}>
    <App viewsConfig={viewsConfig} navbarConfig={navbarConfig}/>
  </Provider>, document.getElementById('root')
);
Now patternfly c3 js code is available for use within the global context. Next, we need some configurations we'll be adding on top of the default configurations offered by patternfly for a line chart.
chartData.js
export const CHART_CONFIG = {
  line: {
    bindto: "#chart-pf-sparkline",
    data:  {
      columns: [
        ['%', 10, 50, 28, 20, 31, 27, 60, 36, 52, 55, 62, 68, 69, 88, 74, 88, 95],
      ],
      type: 'area'
    }
  },
};
Now, in our main_page, where we will be displaying the chart, we will import the config and chart component, get the default configs and add our additional configs from chartData (over-writing if necessary) and pass it into our chart component along with the element to which the chart will be bound to (in our case it's #chart-pf-sparkline as per the CHART_CONFIG).
main_page.jsx
import React, { Component } from "react";
// Import our chart config and Chart Component from the library
import { CHART_CONFIG } from './chartData.js';
import ChartComponent from '../pf-lib/c3Charts/chart.jsx';
export class main_page extends Component {
render() {
// Get default c3 configs, and add our additional changes from Chart_Config
let defaultConfig = $().c3ChartDefaults().getDefaultSparklineConfig();
let config = {...defaultConfig, ...CHART_CONFIG.line};
return (
<div className="col col-cards-pf container-cards-pf fader">
<div className="cards col-xs-10 col-md-8 ">
<div className="card-pf card-pf-accented">
<div className="card-pf-heading c">
<h2 className="card-pf-title">
C3 Charts Example
</h2>
<div className="card-pf-footer row">
<div className="col-sm-offset-4 col-sm-4 ">
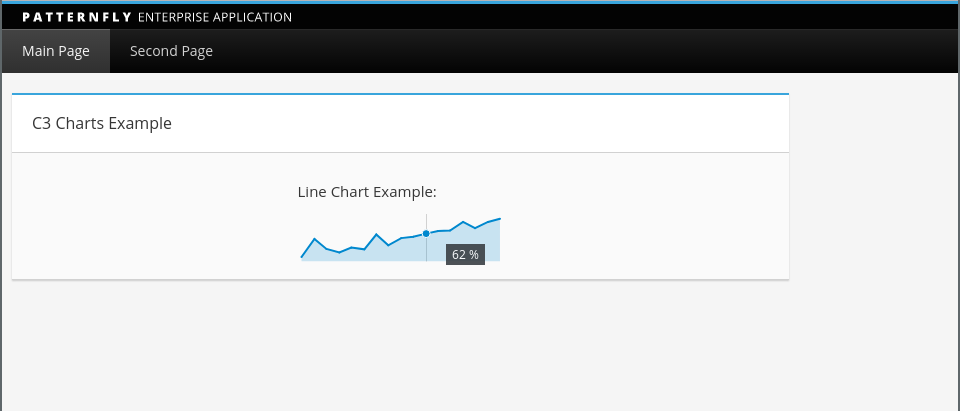
<h4> Line Chart Example: </h4>
{/* Chart component takes the element and config as a prop */}
<ChartComponent element='chart-pf-sparkline' config={config}/>
</div>
</div>
</div>
</div>
</div>
</div>
)
}
}
export default main_page
Note that the element passed as a prop to ChartComponent must match the one defined within the config object. The result should look as follows:
Changes after chart generation
Suppose you want to execute code after the chart generates but before the component renders the chart. The chart component takes an optional prop called generateCallback which is a function that is invoked after the chart component is generated but before it's rendered. Consider the following donut chart example similar to the line chart above:
export class main_page extends Component {
render() {
// Build config for donut chart
let defaultConfig = $().c3ChartDefaults().getDefaultDonutConfig();
let donutConfig = {...defaultConfig, ...CHART_CONFIG.donut};
return (
<div className="col col-cards-pf container-cards-pf fader">
<div className="cards col-xs-10 col-md-8 ">
<div className="card-pf card-pf-accented">
<div className="card-pf-heading c">
<h2 className="card-pf-title">
C3 Charts Example
</h2>
<div className="card-pf-footer row">
<div className="col-sm-offset-4 col-sm-4 ">
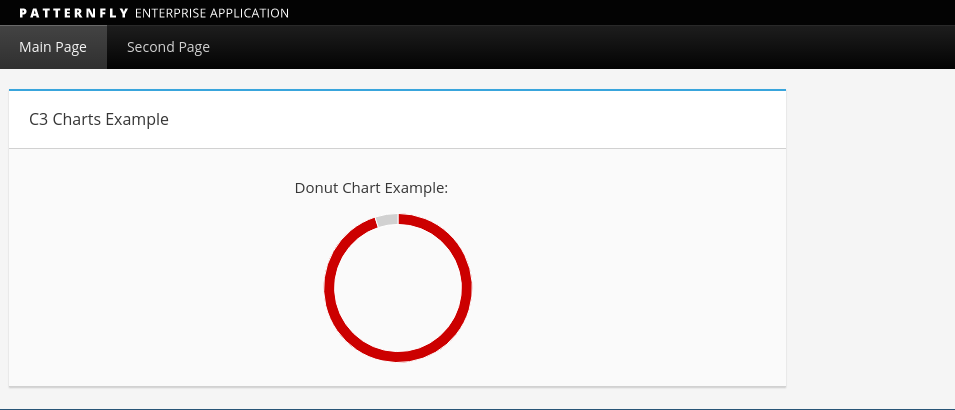
<h4> Donut Chart Example: </h4>
<ChartComponent element='chart-pf-donut' config={donutConfig}/>
</div>
</div>
</div>
</div>
</div>
</div>
)
}
}
Resulting the following display:
Suppose we wanted to insert text in the center of the chart using d3 to select the chart element, i.e. invoke the following code:
Note that we import d3 similar to we did c3 in the beginning of this page using script-loader so we may use it here:
let donutChartTitle = d3.select("#chart-pf-donut").select('text.c3-chart-arcs-title');
donutChartTitle.text("");
donutChartTitle.insert('tspan').text("950").classed('donut-title-big-pf', true).attr('dy', 0).attr('x', 0);
donutChartTitle.insert('tspan').text("MHz Used").classed('donut-title-small-pf', true).attr('dy', 20).attr('x', 0);
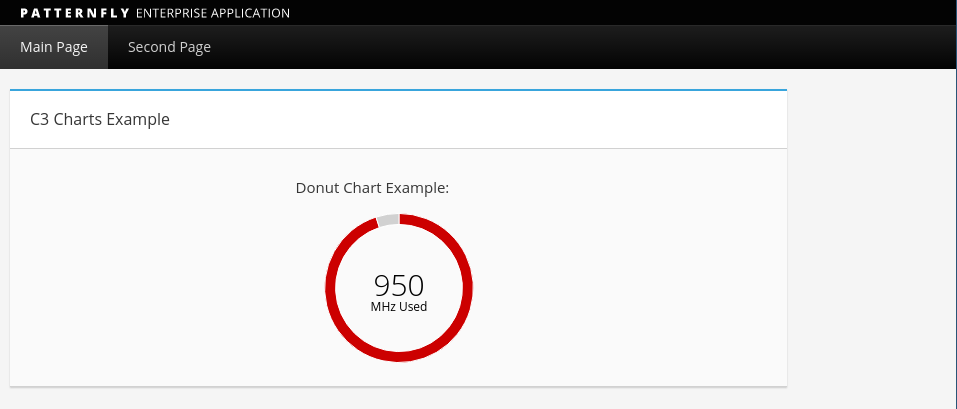
We can wrap this code as a callback and pass it along as a prop to the chart component, and the component will invoke it for you before rendering:
export class main_page extends Component {
  render() {
    // Build config for donut chart
    let defaultConfig = $().c3ChartDefaults().getDefaultDonutConfig();
    let donutConfig = {...defaultConfig, ...CHART_CONFIG.donut};

    // This call back will be invoked once the donut chart is generated
    let generateCallback = () =>
    {
      let donutChartTitle = d3.select("#chart-pf-donut").select('text.c3-chart-arcs-title');
      donutChartTitle.text("");
      donutChartTitle.insert('tspan').text("950").classed('donut-title-big-pf', true).attr('dy', 0).attr('x', 0);
      donutChartTitle.insert('tspan').text("MHz Used").classed('donut-title-small-pf', true).attr('dy', 20).attr('x', 0);
    };
    return (
      <div className="col col-cards-pf container-cards-pf fader">
        <div className="cards col-xs-10 col-md-8 ">
          <div className="card-pf card-pf-accented">
            <div className="card-pf-heading c">
              <h2 className="card-pf-title">
                C3 Charts Example
              </h2>
              <div className="card-pf-footer row">
                <div className="col-sm-offset-4 col-sm-4 ">
                  <h4> Donut Chart Example: </h4>
                  {/* Chart component can also take a callback that is invoked once the chart is generated */}
                  <ChartComponent element='chart-pf-donut' config={donutConfig} generateCallback={generateCallback}/>
                </div>
              </div>
            </div>
          </div>
        </div>
      </div>
    )
  }
}
This will result in the following display: